The Magic Pattern on Forex Market: "M & W Pattern"
MW MT4 Indicator [ Here ]
MW Pattern Live signals [ Telegram channel ]
MW Indi + Scanner + MW dashboard
Full package Indi - 2021 released [ Combo ]
*** M -W Pattern Indicator ***
Get Alerted as soon as a "M "or "W" appears on your charts !
The advantage of such indicator is that it's doing all the hard work for you. It scans many pairs as you want for 4 different timeframes (M30 to Daily).
Let's say 28 crosses, so it checks in realtime (28*4) 112 charts 24 hours 5 days a week. Would do the tedious work on your own? Just get alerted when it's about to happen.
The Indicator doesn't repaint and once attached to the chart it displays previous patterns:
- Red cross = Sell Signal (W Pattern)
- Blue cross = Long Signal (M Pattern)
What is CSA?:
M&W Pattern Indi is embedded with CSA (Currency Strength Analyser)
This tool indicates which currency is the strongest (top of the dasboard) and which currency is the weakest (bottom of the dashboard)
This tool is used to filter signals... in some conditions, we reverse original signal. For example we sell on M and sometimes we buy on W.
Refer to this post to see examples [ Here ]
Important to read:
By default, Indicator will not alert for patterns on M30 & H1 as parameters are set to false.
"Alert_M30" & "Alert_H1" can be set to true. I simply do not recommend to take into accounts these calls if an high impact news has been released 20 mins ago.
FAQ: How to install M&W Pattern Indi
1) Copy the Indicator file into C:\Program Files\YourBrokerFolder\MQL4\Indicators
2) Restart MT4
Introduction to the Pattern
Find out on Indonesian Forum [ here ] provided by [ cevsmile ]
Market leaves a structure price behing itself. A repetitive structure price is also called "Pattern" and it can be a very strong signal of imminent trend such as Head & Shoulder, Harmonics... My Pattern is like a subliminal message left on your chart chart. Keep in mind that if there is no major reason (fundamental) to keep market under pressure, then market rises, especially after a "M". The opposite Pattern looks like a "W"
- M Pattern is a Double Bottom drawn by a specific structure price
- It can be a Tripple Bottom when Center Point is confused into Support
- W Pattern is a Double Top drawn by a specific structure price
- It can be a Tripple Top when Center Point is confused into Resistance
1) The "M Pattern" rules:
- Right Shoulder higher than Left Shoulder (Perfect Pattern)
- Center Point is above left & right base
- Left & right base must be on the same support level.
Bullish Pattern
The opposite Pattern (Bearish) looks like a "W"
=> Center Point is a key level to watch to confirm or not the continuation of the trend
2) How to set SL & TP?
- SL is set just below the left base.
- TP is equal to right shoulder from left base and set from right Shoulder.
EURJPY H4 September 2014 , M Pattern
TP (in detail):
- Left base = 135.70
- Right shoulder = 138.25
- Theorical TP = Right shoulder + (Right shoulder - Left base); 138.25 - 135.70 = 255 pips
- Theorical TP = 138.25 + 255 pips = 140.80
- SL = 50 pips
- TP = 510 pips
- Risk/Reward = 1/10
GBPCAD H4 October 2014, M Pattern
So...- SL = 45 pips
- TP = 369 pips
- Risk/Reward = 1/8
EURUSD H1 October 2014 (W Pattern)
USDCHF H1 October 2014 (M Pattern)
3) Specific Live examples
NZDCHF H1 October 2014 (M & W in a row successful)
EURUSD H1 October 2014 (M & W Pattern in a row unsuccessful)
USDPNL H4 October 2014 (Matrioshka Pattern: M into W)
USDCAD Daily July 2013 (Matrioshka Pattern: W into M)
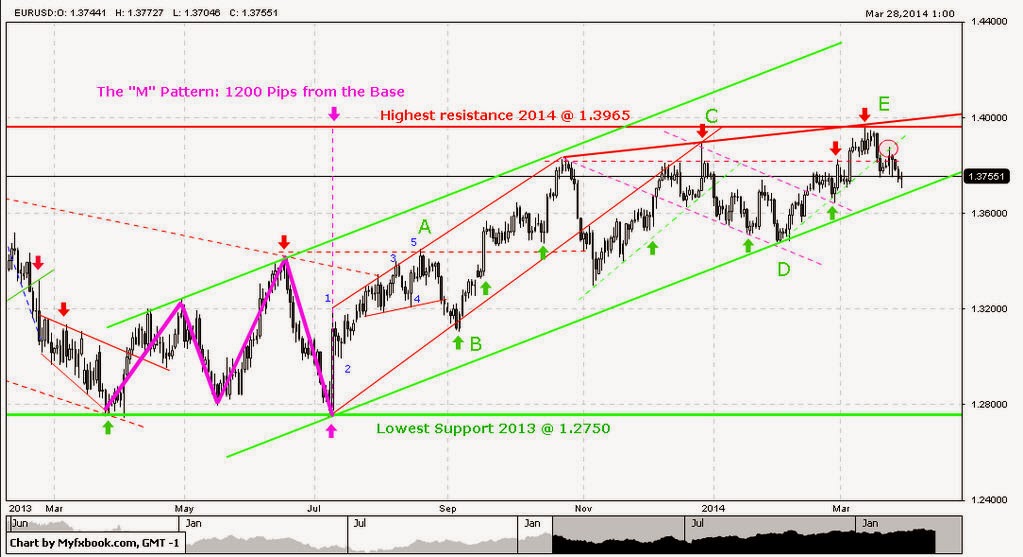
Example: EURUSD 2014 - M Pattern canceled by Center Point
Market can't break and close above Center Point. This level is a resistance and market is rejected twice. Therefore we can reverse the trade as we suspect strong down trend.5) How to filter those Patterns?
- Avoid M Pattern on top of the chart
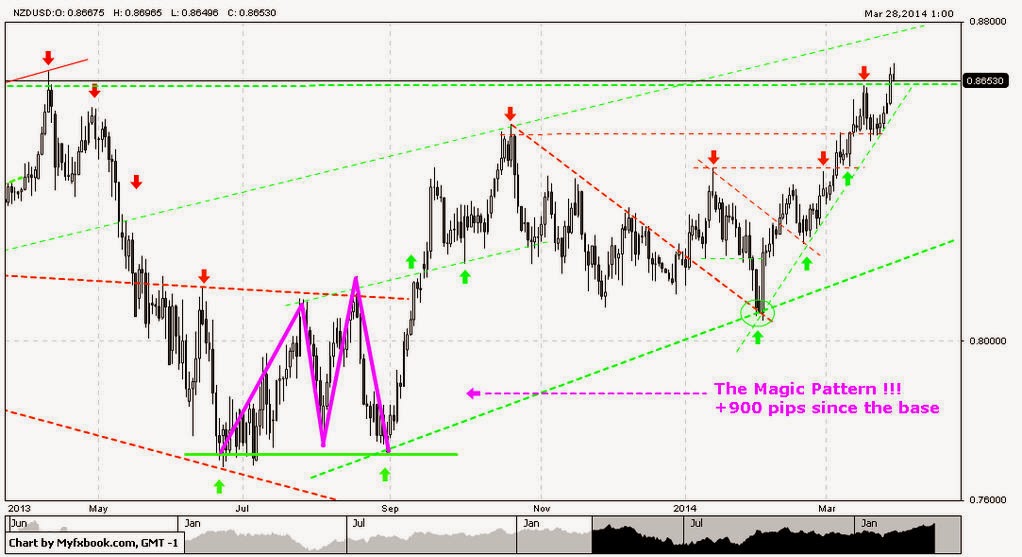
NZDUSD Daily April 2014 (M Pattern not well located)
- Avoid W Pattern on bottom of the chart
EURJPY H4 October 2014 (W Pattern not well located)
What happen next?
We had just a little retracement until Center Point.
6 ) Timeframe to look at?
- From 30 min to Daily chart. (Best signals given by H4 & D1)
- Avoid Patterns after a news, especially Patterns issued on low TimeFrame.
7) Patterns can happen on highest Timeframe (Monthly chart)
Obviously on higher Timefame, those patterns doesn't occur very often, but when they do, Risk/Reward is absolutely fantastic: + 5500 pips from signal given by M Pattern.
8) How and where to take profit?
Last time I warned in realtime for M Pattern
Check out special Thread on MyFxbook [ Here ]
- Long signal was issued on 03/19/2014
- Performance: +900 pips
Result: September 2014 (6 months later)
Past "M & W" Pattern on Forex Market (Daily chart)
Daily M Pattern detailed below


Was looking for an indicator just like this as mostly whatever I have tried has major issues with repaint, but thank God there is nothing like this in this one… Really nice setup… May God bless you.... MJ Henry....
ReplyDeleteHey, thank you for your feedback. Hope you keep enjoying it : )
DeleteCool indicator dude, I am already using MA so nice to have another addition into my list while I am very pleased with this alert system, it helps me spot any good opportunities rather easily without having to research for it. Keep it up … Best regards.
ReplyDeleteTrying out this indicator since last 2 weeks on demo account, it’s working really positively. Although it’s impossible to get 100% results, but still from whatever I have achieved so far I feel really satisfied. I won 23 trades out of 28 which is very impressive… Thank you the indicator mate. Cheers!
ReplyDeleteHi, i just bought it how do i get the Licence??
ReplyDeleteHow can I get the indicators
ReplyDeleteThey look great for a price action trader
ReplyDeletedoes it work on Mt5
ReplyDeleteI want to get the indicator. Please let me know how much it cost and how to get it thanks
ReplyDeleteIs it a mobile support app too?
ReplyDeleteThhis is awesome
ReplyDelete